13 Lab 1 - Data Analysis
After attending the practical lab, you should:
Download the image of your gel and follow the instructions in Section 13.2 for analysing/interpreting your data.
In lab 2, you will examine and record the results from your streak and spread plates. You should read Section 13.1 and Section 16.1 to make sure you understand what to expect in the next lab session, and how to interpret your data.
13.1 Task 1A
In the next lab session, you will be able to observe your streak and spread plates. You will examine the colony morphology on each plate in order to learn about how colony morphology can aid in microbial identification (Section 16.1).
You will also want to evaluate your plates to understand how competently you performed the tasks - whether and how you can improve your technique for preparing and plating serial dilutions, and streaking for single colonies.
13.1.1 Task 1A - Evaluating your Streak Plates
We will help you to evaluate your streak plates and determine how you can improve your technique (if necessary).
A good streak plate has the following characteristics:
It has well-separated, distinct individual colonies
It makes good use of all of the available space on the plate
It is clearly and legibly labelled, with the label not obscuring the centre of the plate
Eight examples of streak plates have been provided in Figure 13.1 for you. Can you diagnose the error(s) - if any - that were made in streaking out each plate?
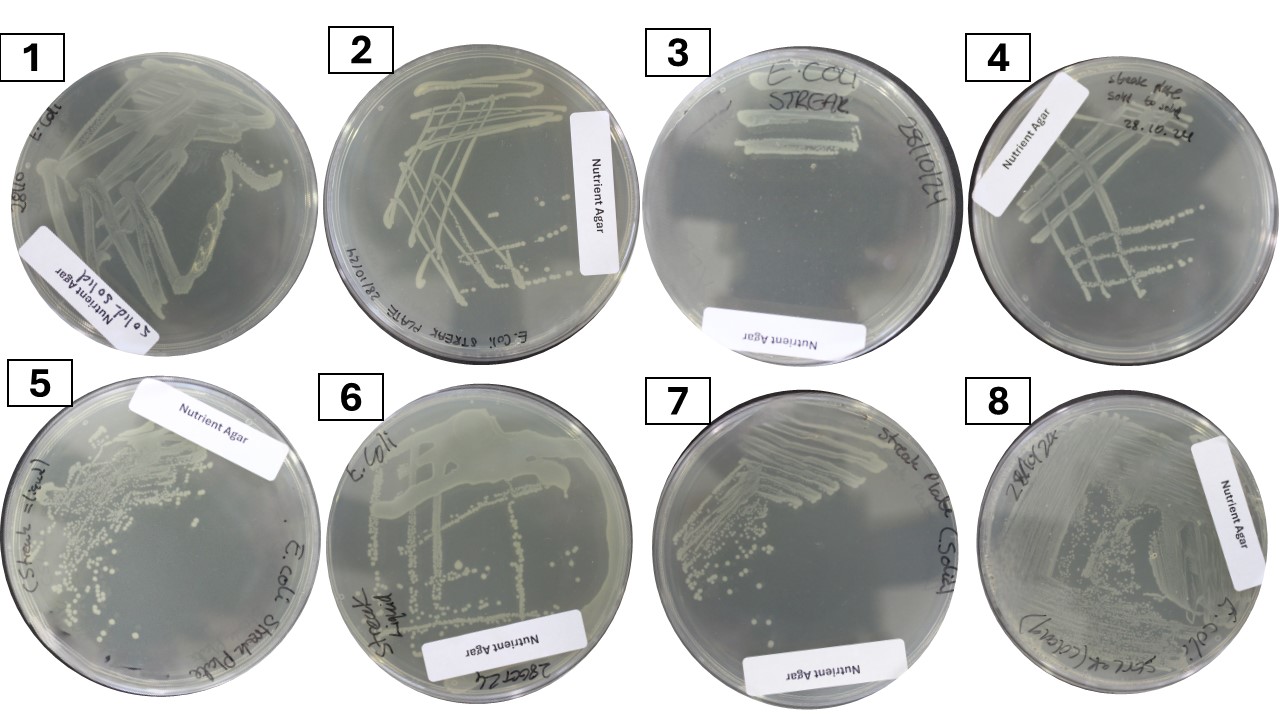
When trying to evaluate a streak plate, try to think of what actions could have produced that plate: which sector (quadrant) was streaked first? when/how often was the loop flamed? were any of the sectors inoculated with too many bacterial cells?
13.1.2 Task 1A - Quantifying the Number of Microbes in a Sample: Serial Dilutions
It is often necessary or desirable to work backwards from the number of colonies on a plate, in order to work out the number of viable microbes that were present in the original (undiluted) sample. (Note that any microbes present in the sample that were dead, or viable-but-not-culturable, will not give rise to colonies on the plate - so you are enumerating the number of viable microbes, not the number of cells.)
We calculate and express the number of viable microbes in the original sample in colony forming units (cfu) - usually in cfu/mL.
For example, if you performed a decimal serial dilution, plated 0.1 mL of the 10-4 dilution, and counted 173 colonies on the resulting plate (Figure 13.2) - how many viable bacterial cells were present in the original culture?
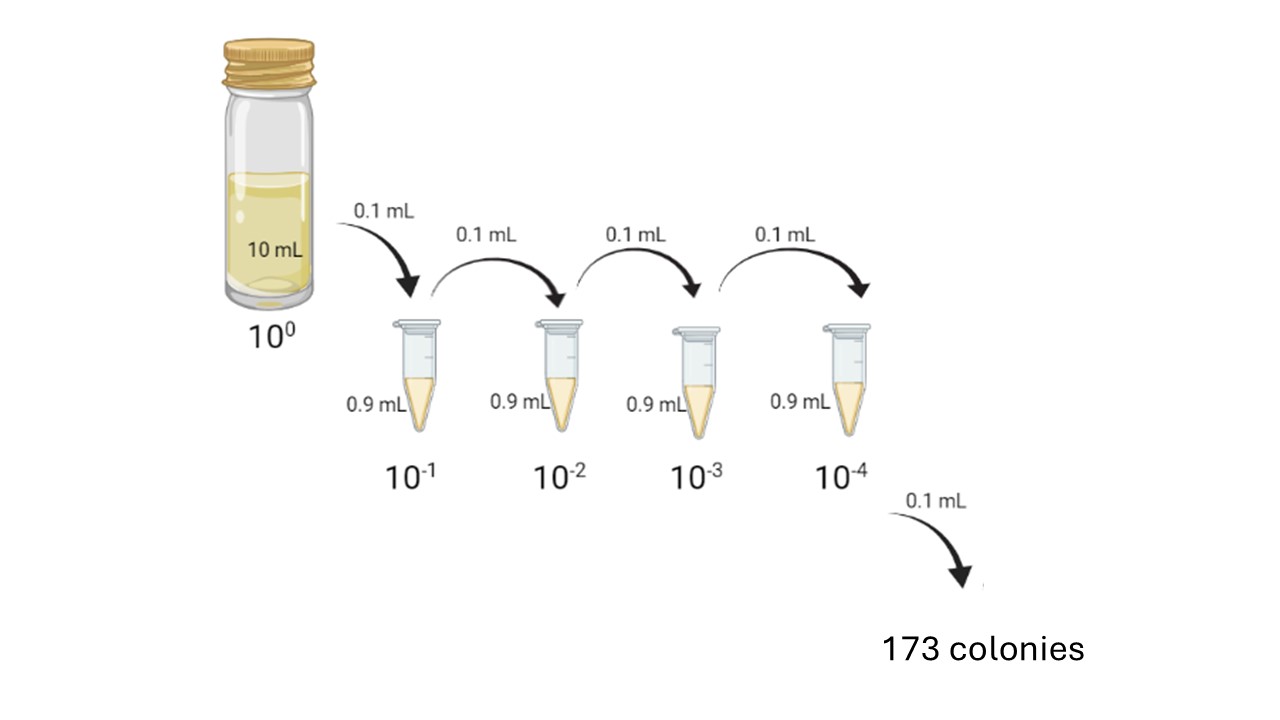
Here, we had 173 colonies in 0.1 mL of the dilution present in the 10-4 dilution tube.
To calculate the number of cfu/mL present in the original sample, divide the number of colonies on your plate by the total dilution factor: in this case, 173 colonies/(0.1 mL * 10-4) = 1.73 * 107 cfu/mL.
Make sure you label your plates with the dilution factor - you will need this for the calculations!
Ideally, you want to count colonies on a plate that has 30-300 colonies. We normally consider <30 colonies to be Too Few To Count (TFTC) and more than 300 colonies to be Too Numerous To Count (TNTC). You will get more accurate estimates of your viable cell count if you use a countable plate.
Make sure you use the correct number of significant figures in your answer - you can’t be more precise than your initial measurement (number of colonies counted).
Make sure you express your answer in scientific notation (e.g., 1.73 * 107 cfu/mL, not 17300000) and include units.
When you’ve finished your calculation, double-check that your answer makes sense! For example, you can’t have a fraction of a colony forming unit - so if your answer looks like 1.73 * 10-7 cfu/mL, you have probably gone awry with your handling of exponents somewhere.
13.2 Task 1B - Interpreting your Gel Results
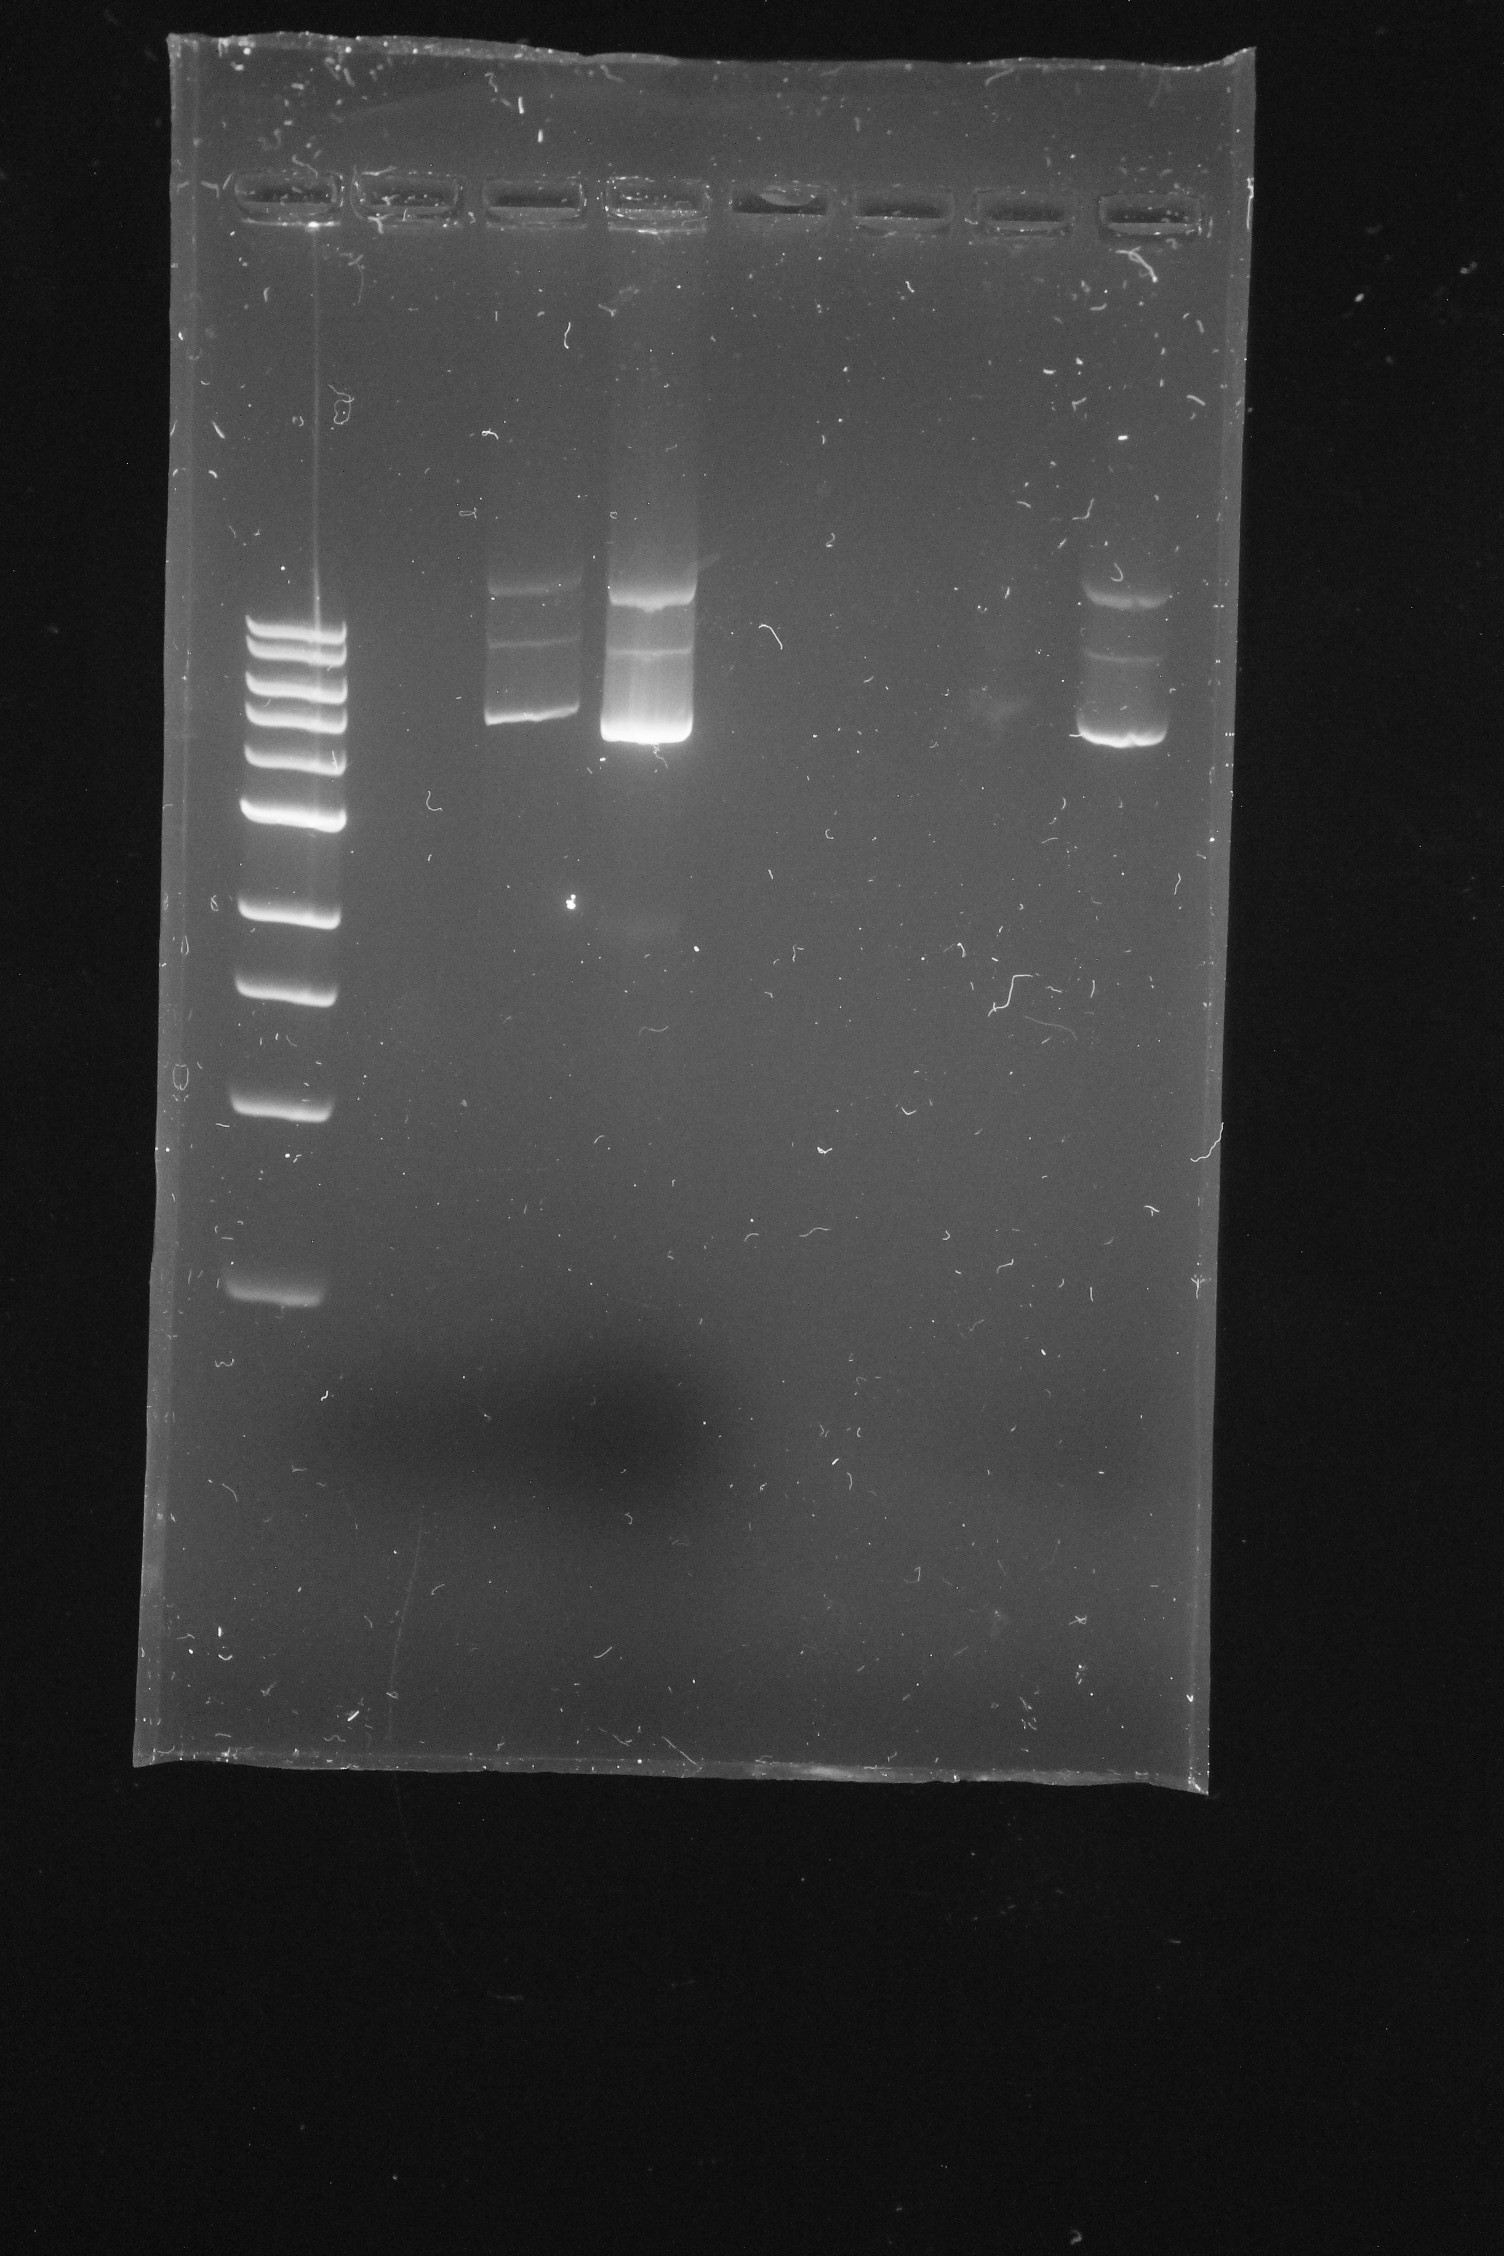
When your gels have finished running, the technicians will place them on the UV transilluminator and take photographs of them for you. These will them be uploaded to MyPlace, where you will be able to download them. Your results will probably look something like this: Figure 13.3.
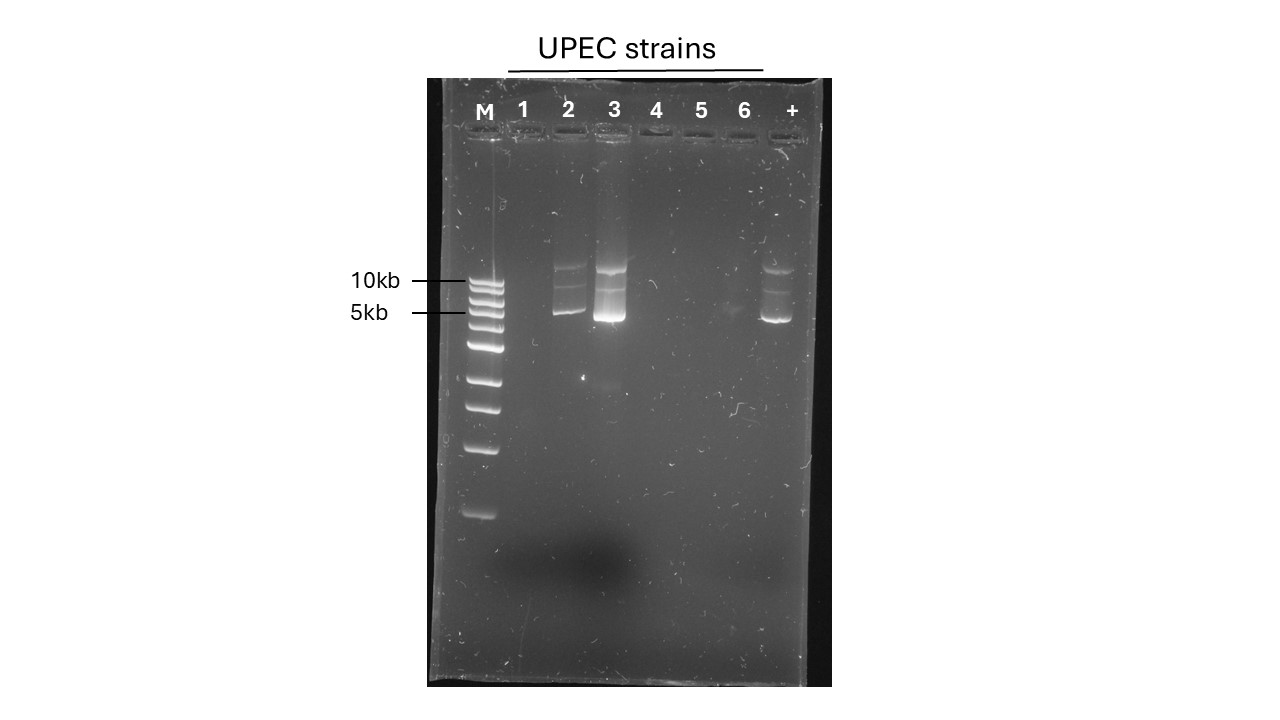
You should annotate your gel (label the DNA ladder and wells with their sample names), as for example in Figure 13.4.
You can find the product information sheet for the DNA ladder which we used in this lab, including the size of each band, on the manufacturer’s website.
Questions to consider/discuss with your lab partners:
In the example gel in Figure 13.4, how many of the 6 UPEC strains contain plasmid DNA? Do any strains contain more than one plasmid?
What can you conclude about the number and size of the plasmid(s)?
What about your gel - what do you observe, what conclusions can you draw?
What experiments could you perform to determine whether any of the plasmids contain pathogenicity islands?
1-3. Remember that most bacterial plasmids are circular, and that circular and linear DNA molecules migrate differently in agarose gels.
- A good experiment here would keep in mind the definition of a pathogenicity island and would include any necessary experimental controls.